

This section presents the conceptual model in stages, based on the research questions developed from the literature review and hypotheses generated from each research question (Table 2).
Table 2. The research questions and associated hypotheses
| Research questions | Hypotheses |
|---|---|
| 1: Do attitudes towards gender inequality (AGIS) predict attitudes towards violence against women (AVAWS)? | 1: Higher AGIS will predict higher AVAWS. |
| 1a: Will subscales of AGIS (Reinforce Gender Roles; Undermine Leadership; Limit Autonomy; Normalise Sexism; Deny Inequality) differentially predict AVAWS? | 1a: Subscales of AGIS will differentially predict AVAWS, with private AGIS (Limit Autonomy) having a stronger relationship with AVAWS than public AGIS (Undermine Leadership). |
| 1b: Does gender (identifying as a man compared to identifying as a woman or non-binary person) moderate the relationship between AGIS and AVAWS? | 1b: Gender will moderate the relationship between AGIS and AVAWS, with the relationship being stronger for men than for women. |
| 2: Does UVAWS mediate the relationship between AGIS and AVAWS? | 2: UVAWS will mediate the relationship between AGIS and AVAWS, with high UVAWS eliminating the relationship between AGIS and AVAWS. That is, the association between AGIS and AVAWS is dependent on a person’s understanding of violence against women. |
| 3: Does believing violence against women is not a problem where you live (Distancing) mediate the relationship between AGIS and AVAWS? | 3: Distancing will mediate the relationship between AGIS and AVAWS, with greater degrees of Distancing reducing the relationship between AGIS and AVAWS. That is, the association between AGIS and AVAWS is dependent on a person believing violence is a problem where they live. |
| 4: Are UVAWS and Distancing associated with each other? | 4: UVAWS and Distancing will be associated with each other, with lower acknowledgment that violence against women is a problem where people live being associated with lower understanding and knowledge of violence against women and its gendered nature. |
| 5: How much variation in attitudes towards violence against women is accounted for by the full structural equation model? | 5: With all variables entered into the structural equation model, the individual relationships identified above will largely persist, and the full conceptual model will account for a high proportion of variance in attitudes towards violence against women in Victoria. |
RQ1: Do attitudes towards gender inequality (AGIS) predict attitudes towards violence against women (AVAWS)?
Based on previous research, including analysis of NCAS data, we predict a direct association between attitudes supporting or endorsing gender inequality and attitudes supporting or endorsing violence against women. We expect this association to be strong, with more gender-equal AGIS scores associated with less violence-supportive AVAWS scores.
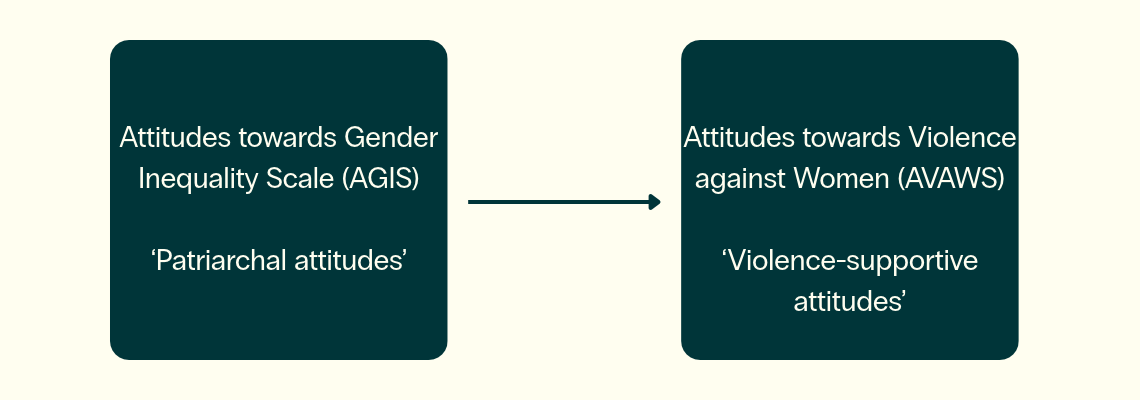
Hypothesis 1: Higher AGIS will predict higher AVAWS
Results: The data support the hypothesis.
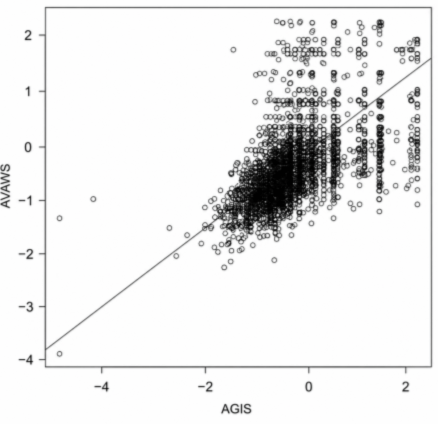
Table 3 and Figure 2 present the results of the structural equation model. Higher scores on the AGIS predict higher scores on the AVAWS. The regression estimate of 0.675 (Table 3) indicates a positive, moderately strong relationship between AGIS and AVAWS. For each one-unit increase in AGIS (more gender-equal attitudes), AVAWS increases by 0.675 units (less violence-supportive attitudes). Conversely, lower AGIS scores are associated with lower AVAWS scores (more violence-supportive attitudes).
Table 3. SEM predicting AVAWS from AGIS
| Type | Outcome | Predictor | Estimate | Std.Err | z-value | P(>|z|) | ci. lower | ci. upper | Std.lv | Std.all |
|---|---|---|---|---|---|---|---|---|---|---|
| Regression | AVAWS | AGIS | 0.675 | 0.016 | 43.243 | 0.000 | 0.644 | 0.705 | 0.675 | 0.689 |
| Intercept | AVAWS | – | −0.045 | 0.013 | −3.556 | 0.000 | −0.069 | −0.0200 | −0.045 | −0.046 |
| Note. Std.Err = standard error; P(>|z|) = p-value; ci.lower/ci.upper = 95% confidence interval bounds; Std.lv = latent variable standardised estimate; Std.all = fully standardised estimate. | ||||||||||
Figure 2 depicts a scatter plot of all participants’ scores on AGIS and AVAWS. There is variation across the sample, but it visualises the positive relationship between AGIS and AVAWS (higher AGIS is associated with higher AVAWS). This result is in line with Webster (10), and we will expand on these previous findings by adding additional variables to the model to see if this decreases the strength of the relationship between AGIS and AVAWS.
RQ1a: Will subscales of AGIS (Reinforce Gender Roles; Undermine Leadership; Limit Autonomy; Normalise Sexism; Deny Inequality) differentially predict AVAWS?
We predict that the AGIS subscales related to the private sphere will have a stronger relationship to violence-supportive attitudes than those subscales related to the public sphere.
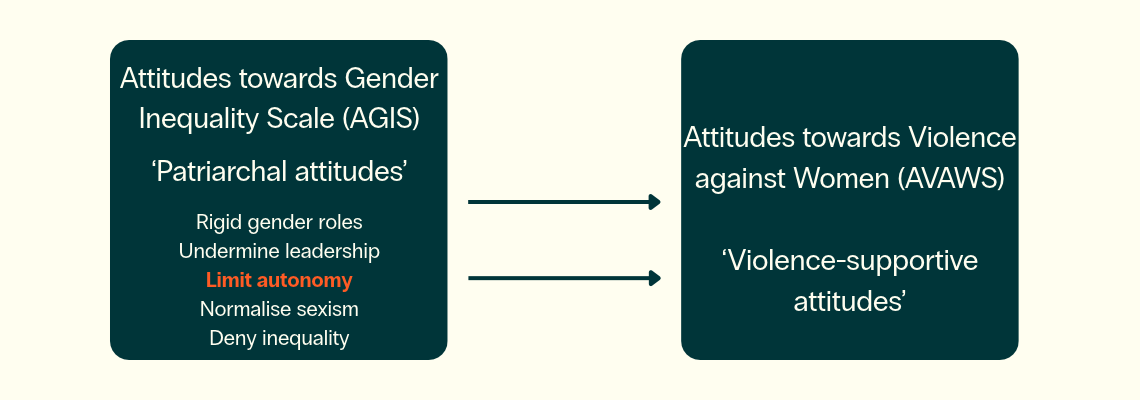
Subscales of AGIS will differentially predict AVAWS, with private AGIS (Limit Autonomy) having a stronger relationship with AVAWS than public AGIS (Undermine Leadership).
Results: The data partially support the hypothesis.
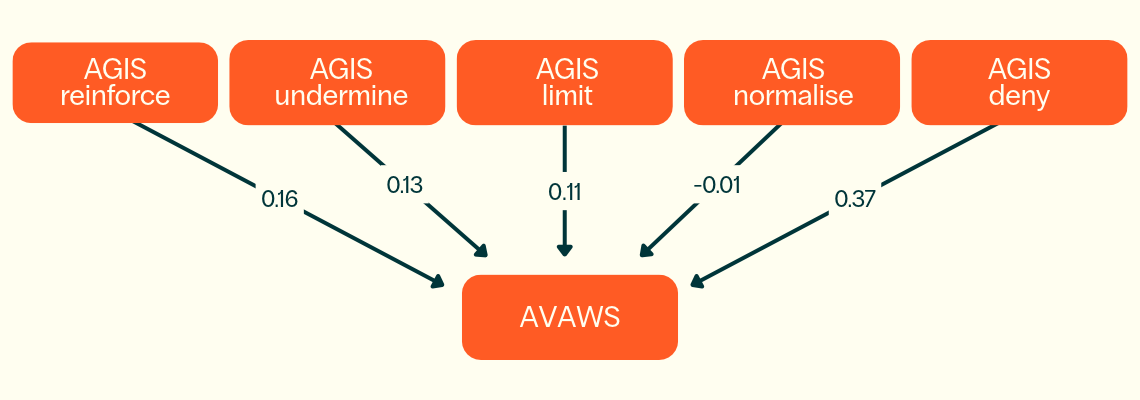
Table 4 presents the results of the structural equation model, showing that AGIS subscales do differentially predict AVAWS, with Deny Inequality having the strongest relationship with AVAWS (followed by Reinforce Gender Roles). This model predicts 43.1% of the variance in AVAWS, meaning 56.9% of the variance in AVAWS is explained by factors not measured in this model or otherwise unknown.
Table 4. SEM showing that AGIS subscales differentially predict AVAWS
| Type | Outcome | Predictor | Estimate | Std.Err | z-value | P(>|z|) | ci.lower | ci.upper | Std.lv | Std.all |
|---|---|---|---|---|---|---|---|---|---|---|
| Regression | AVAWS | AGIS reinforce | 0.162 | 0.020 | 8.200 | 0.000 | 0.123 | 0.201 | 0.162 | 0.186 |
| Regression | AVAWS | AGIS undermine | 0.129 | 0.018 | 7.076 | 0.000 | 0.094 | 0.165 | 0.129 | 0.149 |
| Regression | AVAWS | AGIS limit | 0.115 | 0.018 | 6.281 | 0.000 | 0.079 | 0.150 | 0.115 | 0.125 |
| Regression | AVAWS | AGIS normalise | –0.015 | 0.019 | –0.766 | 0.444 | –0.052 | 0.023 | –0.015 | –0.016 |
| Regression | AVAWS | AGIS deny | 0.371 | 0.023 | 16.051 | 0.000 | 0.325 | 0.416 | 0.371 | 0.399 |
| Intercept | AVAWS | – | –0.116 | 0.017 | –6.776 | 0.000 | –0.150 | –0.083 | –0.116 | –0.123 |
The Deny Inequality estimate of 0.371 indicates a positive and moderately strong relationship between this subscale and AVAWS. Interpreted in the direction of the scale, higher scores on Deny Inequality (greater acknowledgement that gender inequality exists) are associated with higher AVAWS scores (less violence-supportive attitudes). This suggests that reducing denial of inequality is a promising leverage point for reducing violence-supportive attitudes.
Figure 4 presents the path diagram for the SEM testing Hypothesis 1a. The path coefficients indicate that private- and public-sphere AGIS attitudes (Limit Autonomy and Undermine Leadership, respectively) are similarly and significantly associated with AVAWS scores (β = 0.11 and β = 0.13, respectively). These findings suggest that stronger endorsement of gender-inequitable attitudes in the public sphere is associated with slightly higher AVAWS scores than stronger endorsement of gender-inequitable attitudes in the private sphere.
Normalise Sexism does not have a significant path coefficient associated with AVAWS scores in Victoria, an interesting finding given it comprises a core theoretical component of the measurement of AVAWS, and in contrast with findings by Webster, Ward, Diemer and colleagues (7), in which it was the third most highly associated AGIS subscale predicting AVAWS in a regression model (this subscale is called ‘Hostility to Women’ in previous iterations of the NCAS).
RQ1b: Does gender (identifying as a man compared to being a woman or non-binary person) moderate the relationship between AGIS and AVAWS?
We predict that gender will moderate the relationship between AGIS (patriarchal attitudes) and AVAWS (violence-supportive attitudes).
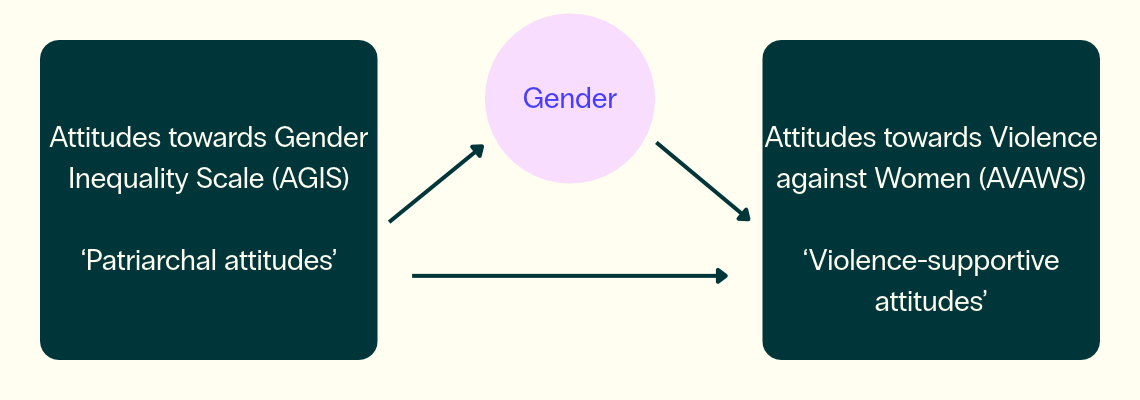
Hypothesis 1b: Gender will moderate the relationship between AGIS and AVAWS, with the relationship being stronger for men than for women.
Results: The hypothesis is partially confirmed.
To test this hypothesis, we first use simple regression (via SEM) to confirm that there is a gender difference in AVAWS scores. In Table 5, we see that being male is notably associated with lower AVAWS scores than being a woman or non-binary (though the variance explained is only 3.1%).
Table 6 presents the AGIS–AVAWS relationship for men, and Table 7 presents the AGIS–AVAWS relationship for women and non-binary people. Table 8 presents a structural equation model that includes the interaction between AGIS and being male, with evidence of gender having a moderating effect.
However, we found that the coefficient for women/non-binary participants (0.706) is slightly higher than that for men (0.623). Based on these coefficients, the hypothesis that the relationship between AGIS and AVAWS would be stronger for men than women is not supported.
Women and non-binary people who hold higher AGIS scores (endorsing gender equality) are more likely to also have higher AVAWS scores (less endorsement of violence-supportive attitudes). Put another way, the AGIS–AVAWS association is slightly weaker for men than for women and non-binary people in this reduced model.
Table 5. AGIS–AVAWS relationship with regression coefficients
| Type | Outcome | Predictor | Estimate | Std.Err | z-value | P(>|z|) | ci.lower | ci.upper | Std.lv | Std.all |
|---|---|---|---|---|---|---|---|---|---|---|
| Regression | AVAWS | Men | –0.339 | 0.032 | –10.710 | 0.000 | –0.402 | –0.277 | –0.339 | –0.175 |
| Intercept | AVAWS | – | 0.033 | 0.024 | 1.404 | 0.160 | –0.013 | 0.079 | 0.033 | 0.034 |
Table 6. The AGIS–AVAWS relationship for men
| Type | Outcome | Predictor | Estimate | Std.Err | z-value | P(>|z|) | ci.lower | ci.upper | Std.lv | Std.all |
|---|---|---|---|---|---|---|---|---|---|---|
| Regression | AVAWS | AGIS (b1) | 0.623 | 0.027 | 23.217 | 0.000 | 0.571 | 0.676 | 0.623 | 0.678 |
| Intercept | AVAWS | (b0) | –0.086
| 0.020 | –4.235 | 0.000 | –0.126 | –0.046 | –0.086 | –0.101 |
Table 7. The AGIS–AVAWS relationship for women and non-binary people
| Type | Outcome | Predictor | Estimate | Std.Err | z-value | P(>|z|) | ci.lower | ci.upper | Std.lv | Std.all |
|---|---|---|---|---|---|---|---|---|---|---|
| Regression | AVAWS | AGIS (b1) | 0.706 | 0.018 | 38.598 | 0.000 | 0.670 | 0.742 | 0.706 | 0.679 |
| Intercept | AVAWS | (b0) | –0.026 | 0.017 | –1.529 | 0.126 | –0.059 | 0.007 | –0.026 | –0.025 |
Table 8. SEM results including the interaction between AGIS and men
| Type | Outcome | Predictor | Estimate | Std.Err | z-value | P(>|z|) | ci.lower | ci.upper | Std.lv | Std.all |
|---|---|---|---|---|---|---|---|---|---|---|
| Regression | AVAWS | AGIS (b1) | 0.706 | 0.018 | 38.598 | 0.000 | 0.670 | 0.742 | 0.706 | 0.721 |
| Regression | AVAWS | Male (b2) | –0.060 | 0.026 | –2.291 | 0.022 | –0.112 | –0.009 | –0.060 | –0.031 |
| Regression | AVAWS | Male AGIS (b3) | –0.083 | 0.032 | –2.552 | 0.011 | –0.147 | –0.019 | –0.083 | –0.057 |
| Intercept | AVAWS | (b0) | –0.026 | 0.017 | –1.529 | 0.126 | –0.059 | 0.007 | –0.026 | –0.027 |
Influence of age and occupation
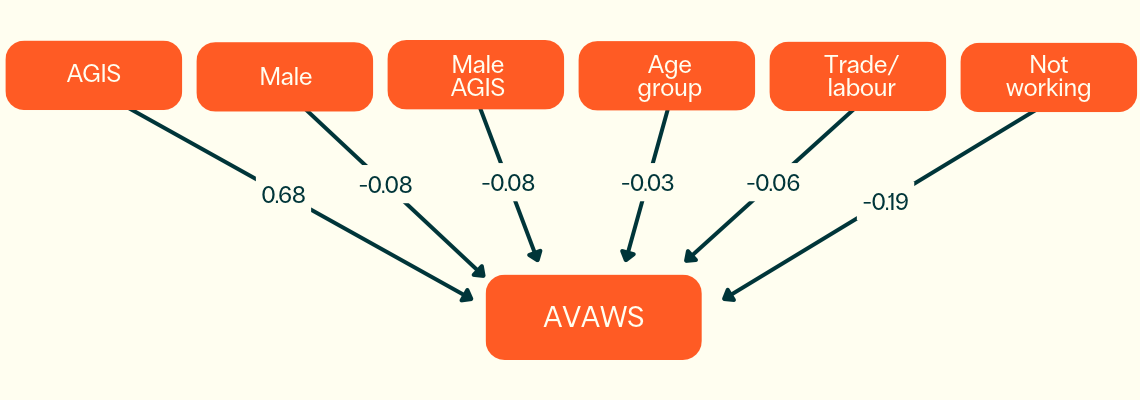
Next, we added age group and occupation (trade/labour or not working, with professional/service as the reference category (footnote 1) as controls to the SEM. The AVAWS scores slightly decrease as respondents get older. Compared to professional/service workers, trade/labour workers and especially those not working have lower AVAWS scores. This model (AGIS and all demographic variables) explains 49.0% of the variance in AVAWS.
Table 9 depicts the SEM with regression coefficients at each stage, and Figure 6 depicts the path coefficients for this stage of the conceptual model, including AGIS and all demographic variables predicting AVAWS. AGIS has the largest coefficient among the variables included in this model. Of the demographic variables, the ‘not working’ category has the largest coefficient. The gender interaction is also statistically significant in this model, though weaker than expected, and the AGIS–AVAWS relationship is slightly stronger for women and non-binary people than for men.
Table 9. SEM results including demographic variables, including AGIS–AVAWS gender moderation effect
| Type | Outcome | Predictor | Estimate | Std.Err | z-value | P(>|z|) | ci.lower | ci.upper | Std.lv | Std.all |
|---|---|---|---|---|---|---|---|---|---|---|
| Regression | AVAWS | AGIS | 0.680 | 0.019 | 36.711 | 0.000 | 0.643 | 0.716 | 0.680 | 0.694 |
| Regression | AVAWS | Male | –0.080 | 0.026 | –3.046 | 0.002 | –0.132 | –0.029 | –0.080 | –0.042 |
| Regression | AVAWS | Male AGIS | –0.076 | 0.032 | –2.393 | 0.017 | –0.137 | –0.014 | –0.076 | –0.052 |
| Regression | AVAWS | Age group | –0.025 | 0.007 | –3.739 | 0.000 | –0.038 | –0.012 | –0.025 | –0.048 |
| Regression | AVAWS | Trade/labour | –0.058 | 0.038 | –1.520 | 0.129 | –0.132 | 0.017 | –0.058 | –0.021 |
| Regression | AVAWS | Not working | –0.189 | 0.027 | –7.120 | 0.000 | –0.241 | –0.137 | –0.189 | –0.097 |
| Intercept | AVAWS | constant | 0.165 | 0.032 | 5.110 | 0.000 | 0.102 | 0.228 | 0.165 | 0.171 |
RQ2: Does understanding of violence against women and its gendered nature (UVAWS) mediate the relationship between AGIS and AVAWS?
We predict that greater understanding of the gendered nature of violence will weaken the relationship between patriarchal attitudes and violence-supportive attitudes, acting as a mediator.
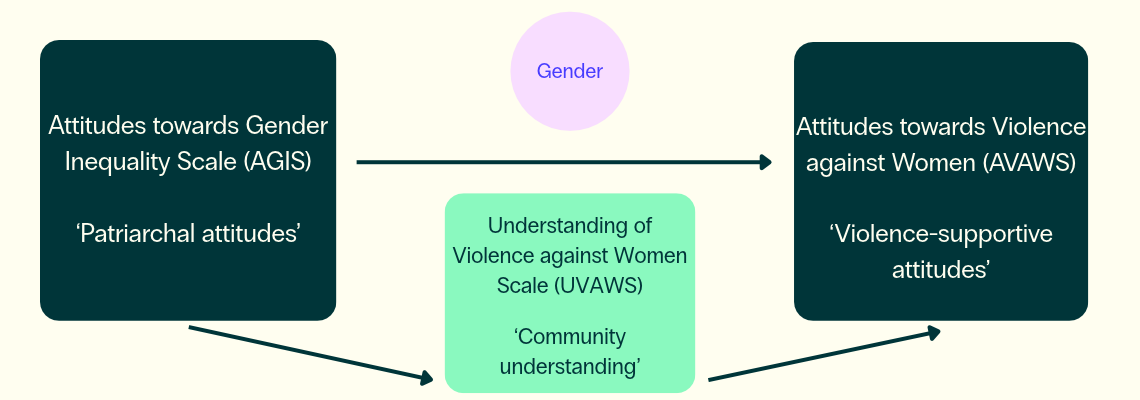
Hypothesis 2: UVAWS will mediate the relationship between AGIS and AVAWS, with high UVAWS eliminating the relationship between AGIS and AVAWS. That is, the association between AGIS and AVAWS is dependent on a person’s understanding of violence against women.
Results: The hypothesis is partially confirmed – UVAWS explains some of the relationship between AGIS and AVAWS, but the relationship between AGIS and AVAWS does not fully depend on a person’s understanding of violence against women.
To test a mediated relationship, we first checked that the three variables are directly associated with each other. In this case, this means that AGIS should be associated with UVAWS, and UVAWS should be associated with AVAWS in turn. Table 10 and Table 11 present the SEM results from this analysis.
Table 10 presents the SEM results predicting UVAWS from AGIS. The expected relationship between AGIS and UVAWS is confirmed, with a coefficient of 0.472 (a one-unit increase in AGIS is associated with a 0.472-unit increase in UVAWS). AGIS accounts for 21.5% of the variance in UVAWS.
Table 10. SEM results predicting UVAWS from AGIS
| Type | Outcome | Predictor | Estimate | Std.Err | z-value | P(>|z|) | ci.lower | ci.upper | Std.lv | Std.all |
|---|---|---|---|---|---|---|---|---|---|---|
| Regression | UVAWS | AGIS (b1) | 0.472 | 0.016 | 29.789 | 0.000 | 0.441 | 0.503 | 0.472 | 0.464 |
| Intercept | UVAWS | (b0) | –0.037 | 0.015 | –2.397 | 0.017 | –0.067 | –0.007 | –0.037 | –0.037 |
Table 11 presents the SEM results predicting AVAWS from UVAWS. The expected relationship between UVAWS and AVAWS is confirmed, with a coefficient of 0.471 (a one-unit increase in UVAWS is associated with a 0.471-unit increase in AVAWS). UVAWS accounts for 24% of the variance in AVAWS.
Table 11. SEM results predicting AVAWS from UVAWS
| Type | Outcome | Predictor | Estimate | Std.Err | z-value | P(>|z|) | ci.lower | ci.upper | Std.lv | Std.all |
|---|---|---|---|---|---|---|---|---|---|---|
| Regression | UVAWS | UVAWS (b1) | 0.471 | 0.015 | 32.136 | 0.000 | 0.443 | 0.500 | 0.471 | 0.490 |
| Intercept | UVAWS | (b0) | –0.085 | 0.015 | –5.849 | 0.017 | –0.114 | –0.057 | –0.085 | –0.088 |
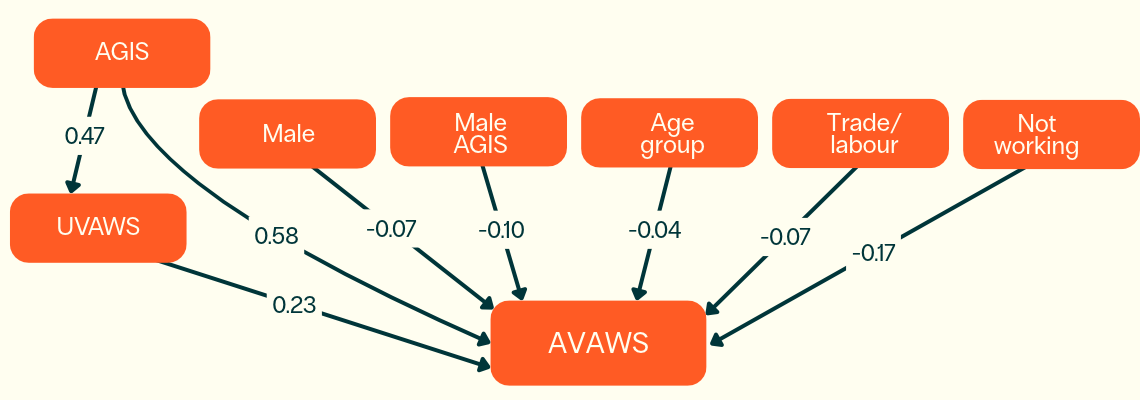
Table 12 presents the results of the SEM testing for mediation, with UVAWS as a mediator between AGIS and AVAWS, and AGIS also acting directly on AVAWS, including demographic variables as controls. This model accounts for 52.6% of the variance in AVAWS.
Including UVAWS in the model reduces the strength of the relationship between AGIS and AVAWS (from 0.68 to 0.58) but does not remove the association. This pattern is described as partial mediation: in these cross-sectional data, UVAWS accounts statistically for part of the AGIS–AVAWS association, but the analysis does not establish that increasing understanding will cause a change in either AGIS or AVAWS.
Table 12. SEM testing for mediation
| Type | Outcome | Predictor | Estimate | Std.Err | z-value | P(>|z|) | ci.lower | ci.upper | Std.lv | Std.all |
|---|---|---|---|---|---|---|---|---|---|---|
| Regression | AVAWS | UVAWS (b) | 0.227 | 0.014 | 16.594 | 0.000 | 0.200 | 0.254 | 0.227 | 0.235 |
| Regression | AVAWS | AGIS (c) | 0.581 | 0.019 | 30.455 | 0.000 | 0.544 | 0.618 | 0.581 | 0.591 |
| Regression | AVAWS | Male (d1) | –0.071 | 0.025 | –2.828 | 0.005 | –0.121 | –0.022 | –0.071 | –0.037 |
| Regression | AVAWS | Male AGIS (d2) | –0.102 | 0.030 | –3.376 | 0.001 | –0.160 | –0.043 | –0.102 | –0.069 |
| Regression | AVAWS | Age group (e1) | –0.044 | 0.006 | –6.840 | 0.000 | –0.057 | –0.032 | –0.044 | –0.084 |
| Regression | AVAWS | Trade/labour (e2) | –0.068 | 0.037 | –1.831 | 0.067 | –0.141 | 0.005 | –0.068 | –0.024 |
| Regression | AVAWS | Not working (e3) | –0.174 | 0.025 | –6.848 | 0.000 | –0.224 | –0.124 | –0.174 | –0.089 |
| Regression | AVAWS | AGIS (a) | 0.472 | 0.016 | 29.789 | 0.000 | 0.441 | 0.503 | 0.472 | 0.464 |
This pattern is consistent with the possibility that knowledge and understanding of violence against women may buffer the association between AGIS and AVAWS, while the relationship also persists independently of understanding. However, because the data are cross-sectional, the model does not demonstrate an intervention effect. The direct association between UVAWS and AVAWS supports further testing of violence-literacy approaches alongside work to address attitudes supporting gender inequality. Figure 8 depicts the SEM path coefficients of this explanatory model.
RQ3: Does believing violence against women is not a problem where you live (Distancing) mediate the relationship between AGIS and AVAWS?
We predict that local acknowledgement of violence as a problem (lower psychological distance) will partially mediate the relationship between AGIS and AVAWS.
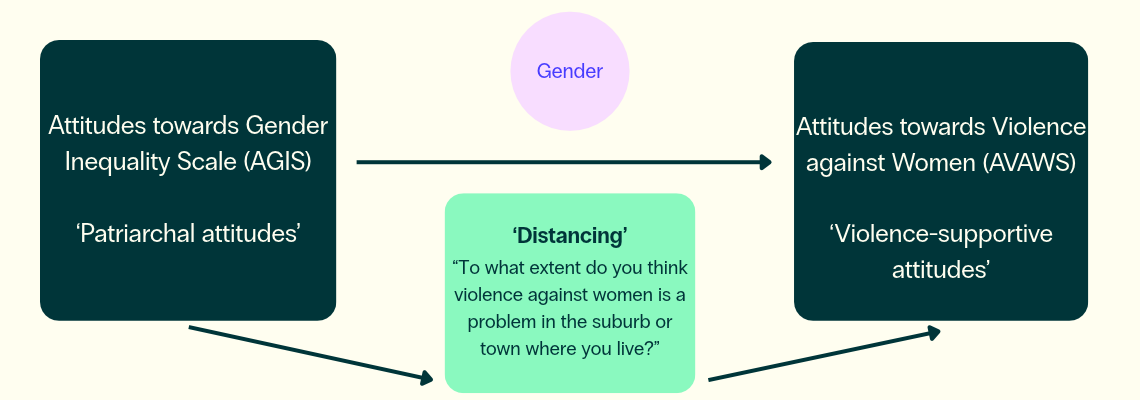
Hypothesis 3: Distancing will mediate the relationship between AGIS and AVAWS, with greater degrees of Distancing reducing the relationship between AGIS and AVAWS. That is, the association between AGIS and AVAWS is dependent on a person believing violence is a problem where they live.
Results: The hypothesis is partially confirmed. Distancing accounts statistically for part of the relationship between AGIS and AVAWS, but it does not fully account for the association. Greater local acknowledgement of violence as a problem (lower psychological distance) is associated with a weaker relationship between endorsement of gender inequality and violence-supportive attitudes. This does not establish that changing perceptions of local relevance will cause changes in violence-supportive attitudes.
As above, to test for a mediated relationship, we first checked that the three variables are directly associated with each other. In this case, this means that AGIS should be associated with Distancing, and in turn, Distancing should be associated with AVAWS. Table 13 and Table 14 present the SEM results from this analysis. Distancing is a reverse-coded numeric variable comprising a single item (‘Violence against women is a problem in the suburb/town where I live’), with higher scores indicating greater local acknowledgement and lower psychological distance.
Table 13 presents the SEM results predicting Distancing from AGIS. The expected relationship between AGIS and Distancing is confirmed, with a coefficient of 0.3 (a one-unit increase in AGIS is associated with a 0.3-unit increase in the Distancing score, indicating greater local acknowledgement). AGIS accounts for 5.3% of the variance in Distancing.
Table 13. SEM results predicting Distancing from AGIS
| Type | Outcome | Predictor | Estimate | Std.Err | z-value | P(>|z|) | ci.lower | ci.upper | Std.lv | Std.all |
|---|---|---|---|---|---|---|---|---|---|---|
| Regression | Distancing suburb | AGIS (b1) | 0.300 | 0.046 | 6.521 | 0.000 | 0.210 | 0.391 | 0.300 | 0.230 |
| Intercept | Distancing suburb | (b0) | 3.387 | 0.050 | 67.855 | 0.000 | 3.289 | 3.485 | 3.387 | 2.532 |
Table 14 presents the SEM results predicting AVAWS from Distancing. The expected relationship between Distancing and AVAWS is confirmed, with a coefficient of 0.199 (a one-unit increase in Distancing is associated with a 0.199-unit increase in AVAWS). Distancing accounts for 8% of the variance in AVAWS.
Table 14. SEM results predicting AVAWS from Distancing
| Type | Outcome | Predictor | Estimate | Std.Err | z-value | P(>|z|) | ci.lower | ci.upper | Std.lv | Std.all |
|---|---|---|---|---|---|---|---|---|---|---|
| Regression | AVAWS | Distancing suburb (b1) | 0.199 | 0.024 | 8.386 | 0.000 | 0.153 | 0.246 | 0.199 | 0.282 |
| Intercept | AVAWS | (b0) | –0.825 | 0.076 | –10.854 | 0.000 | –0.974 | –0.676 | –0.825 | –0.874 |
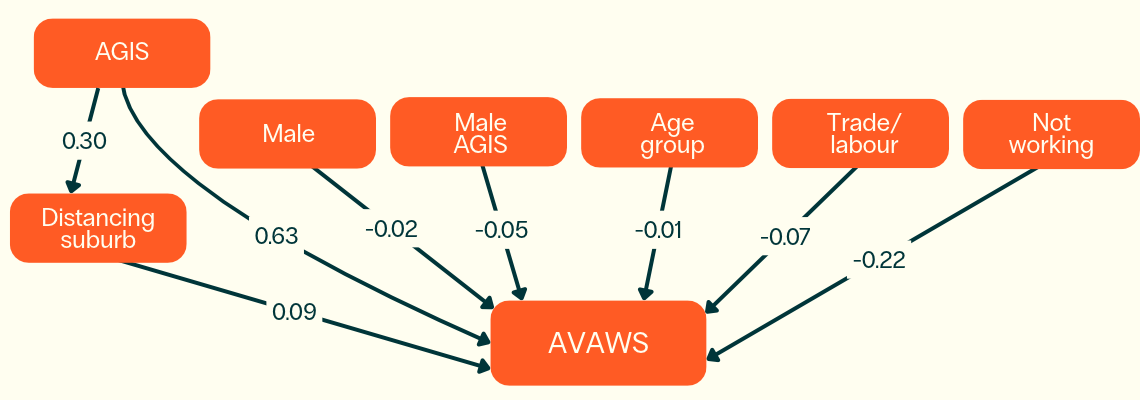
Table 15 presents the results of the SEM testing for mediation, with Distancing as a mediator between AGIS and AVAWS, and AGIS also acting directly on AVAWS, including demographic variables as controls. This model accounts for 54.7% of the variance in AVAWS.
Including Distancing in the model reduces the strength of the relationship between AGIS and AVAWS (from 0.68 to 0.63) but does not remove the association. This pattern is described as partial mediation: greater local acknowledgement of violence as a problem (lower psychological distance) accounts statistically for part of the relationship between gender-inequality attitudes and violence-supportive attitudes. It is consistent with local acknowledgement acting as a possible buffer, but does not establish an intervention effect.
Table 15. SEM results including Distancing mediator
| Type | Outcome | Predictor | Estimate | Std.Err | z-value | P(>|z|) | ci.lower | ci.upper | Std.lv | Std.all |
|---|---|---|---|---|---|---|---|---|---|---|
| Regression | AVAWS | Distancing suburb (b) | 0.093 | 0.018 | 5.244 | 0.000 | 0.058 | 0.128 | 0.093 | 0.132 |
| Regression | AVAWS | AGIS (c) | 0.632 | 0.035 | 18.002 | 0.000 | 0.563 | 0.701 | 0.632 | 0.585 |
| Regression | AVAWS | Male (d1) | –0.021 | 0.052 | –0.399 | 0.691 | –0.122 | 0.081 | –0.021 | –0.011 |
| Regression | AVAWS | Male AGIS (d2) | –0.050 | 0.058 | –0.870 | 0.384 | –0.164 | 0.063 | –0.050 | –0.033 |
| Regression | AVAWS | Age group (e1) | –0.012 | 0.004 | –3.101 | 0.002 | –0.021 | –0.004 | –0.012 | –0.041 |
| Regression | AVAWS | Trade/labour (e2) | –0.070 | 0.037 | –1.883 | 0.060 | –0.214 | 0.074 | –0.070 | –0.027 |
| Regression | AVAWS | Not working (e3) | –0.218 | 0.055 | –3.995 | 0.000 | –0.325 | –0.111 | –0.218 | –0.115 |
| Regression | Distancing suburb | AGIS (a) | 0.300 | 0.046 | 6.521 | 0.000 | 0.210 | 0.391 | 0.300 | 0.230 |
| Intercept | AVAWS | (b0) | –0.245 | 0.078 | –3.165 | 0.002 | –0.397 | –0.093 | –0.245 | –0.260 |
| Intercept | Distancing suburb | (b0) | 3.387 | 0.050 | 67.855 | 0.000 | 3.289 | 3.485 | 3.387 | 2.532 |
The path coefficients for the Distancing mediation model are smaller than those for the UVAWS mediation model, suggesting UVAWS may be a stronger explanatory variable (Figure 10). However, Distancing is measured using a single item on a 5-point scale and was administered to only a subset of the sample. Measuring Distancing-related attitudes using a multi-item scale and administering it to the entire sample may have produced different estimates. The focal path coefficients depicted in Figure 10 are statistically significant, indicating that lower local acknowledgement is associated with more violence-supportive attitudes in this sample.
RQ4: Are UVAWS and Distancing associated with each other?
We predict that individuals with stronger understanding of the gendered nature of violence will be more likely to acknowledge the problem locally, indicating a positive association between UVAWS and the reverse-coded Distancing score.
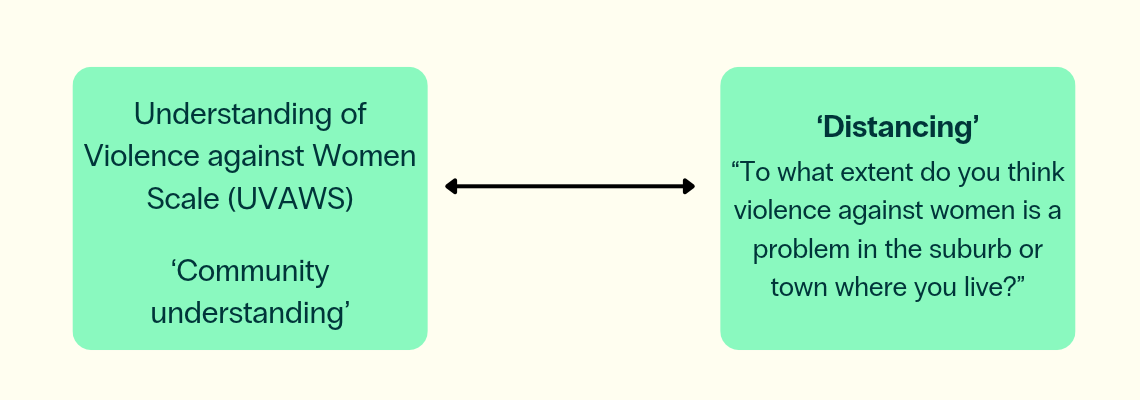
Hypothesis 4: UVAWS and Distancing will be associated with each other, with lower acknowledgment that violence against women is a problem where people live being associated with lower understanding and knowledge of violence against women and its gendered nature.
Results: The hypothesis is confirmed. Distancing and UVAWS are associated with each other.
In the full SEM, UVAWS and Distancing are permitted to covary. Their coefficient of 0.17 indicates that higher understanding of violence against women is associated with greater acknowledgement that violence is a problem in a person’s suburb or town.
RQ5: How much variation in attitudes towards violence against women is accounted for by the full structural equation model?
We predict that the full SEM will account for a high proportion of the variation in AVAWS scores while integrating the proposed predictors, mediators, moderator and demographic controls.
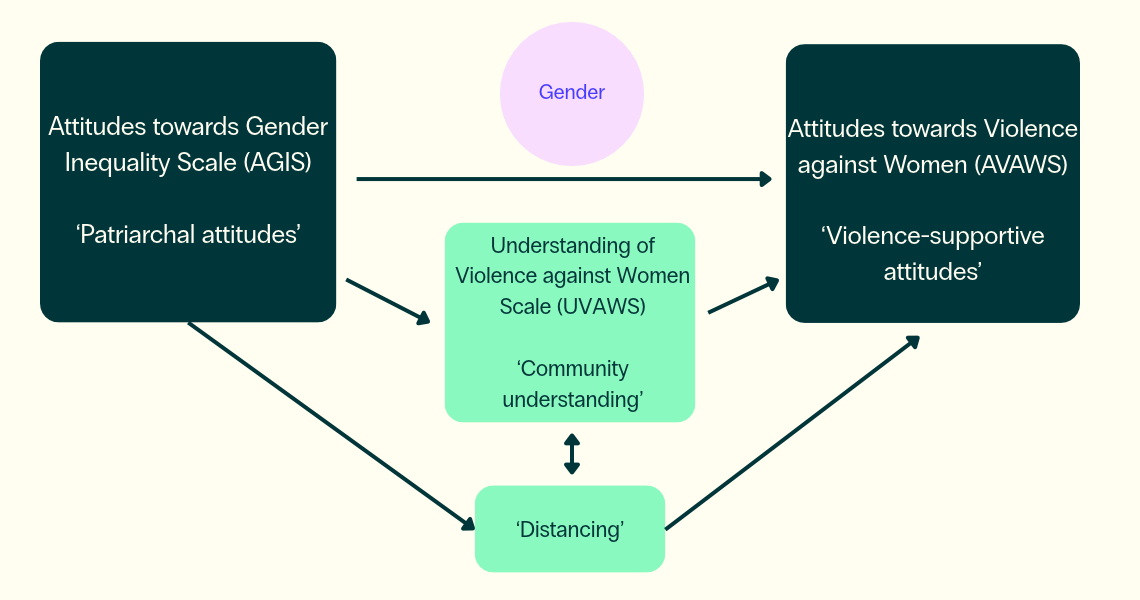
Hypothesis 5: With all variables entered into the structural equation model, the individual relationships identified above will largely persist, and the full conceptual model will account for a high proportion of variance in attitudes towards violence against women in Victoria.
Results: The hypothesis is confirmed, with some caveats.
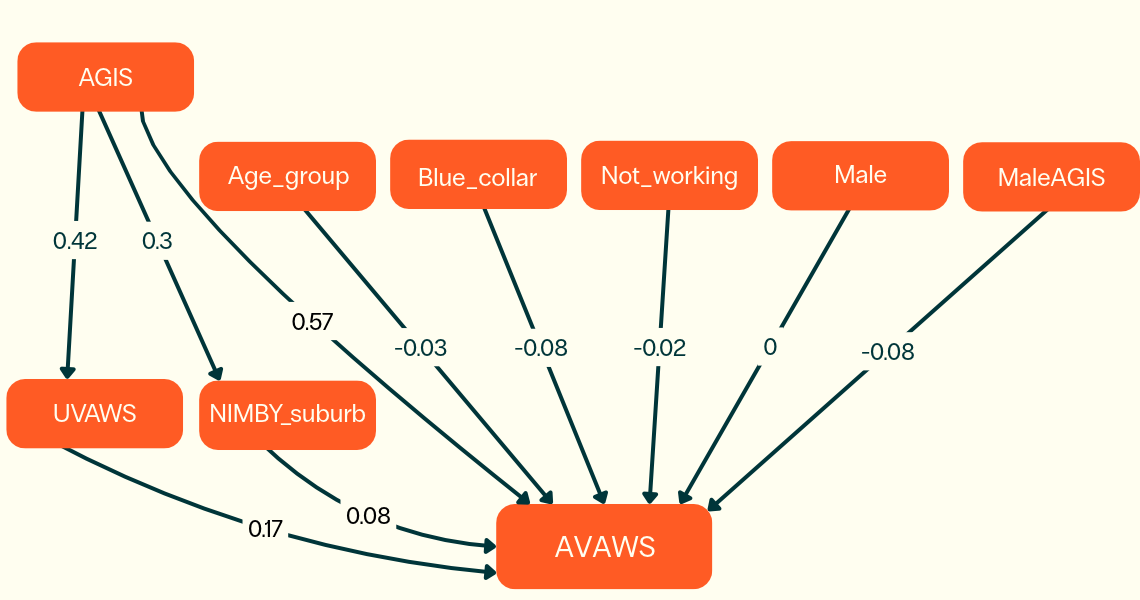
Table 16 presents the full SEM coefficients, including the AGIS–AVAWS relationship, UVAWS and Distancing as proposed mediators, the association between UVAWS and Distancing, gender as a proposed moderator, and demographic controls. The full model accounts for 57.5% of the variation in AVAWS scores. This indicates substantial shared variation among the included constructs, while 42.5% of the variation is associated with factors not measured in the model or otherwise unexplained. It does not establish causal explanation or model completeness.
Among the variables included in the full model, AGIS has the largest standardised coefficient with AVAWS. UVAWS and Distancing also have statistically significant coefficients. Age group and the ‘not working’ category are statistically significant demographic controls, while trade/labour occupation, the gender main effect and the gender-by-AGIS interaction are not statistically significant in the full model. In the separate AGIS subscale model, Deny Inequality has the strongest association with AVAWS, followed by Reinforce Gender Roles.
Table 16. Regression coefficients of all variables entered into the SEM
| Type | Outcome | Predictor | Estimate | Std.Err | z-value | P(>|z|) | ci.lower | ci.upper | Std.lv | Std.all |
|---|---|---|---|---|---|---|---|---|---|---|
| Regression | AVAWS | AGIS (b1) | 0.573 | 0.037 | 15.674 | 0.000 | 0.502 | 0.645 | 0.573 | 0.620 |
| Regression | AVAWS | UVAWS (m1) | 0.169 | 0.028 | 5.960 | 0.000 | 0.113 | 0.224 | 0.169 | 0.172 |
| Regression | AVAWS | Distancing suburb (m2) | 0.079 | 0.017 | 4.655 | 0.000 | 0.046 | 0.113 | 0.079 | 0.112 |
| Regression | AVAWS | Age group (c1) | –0.029 | 0.013 | –2.332 | 0.020 | –0.054 | –0.005 | –0.029 | –0.057 |
| Regression | AVAWS | Trade/labour (c2) | –0.084 | 0.073 | –1.146 | 0.252 | –0.226 | 0.059 | –0.084 | –0.032 |
| Regression | AVAWS | Not working (c3) | –0.203 | 0.063 | –3.246 | 0.001 | –0.326 | –0.080 | –0.203 | –0.106 |
| Regression | AVAWS | Male (d1) | –0.003 | 0.052 | –0.057 | 0.954 | –0.104 | 0.098 | –0.003 | –0.002 |
| Regression | AVAWS | Male AGIS (d2) | –0.076 | 0.058 | –1.314 | 0.189 | –0.189 | 0.037 | –0.076 | –0.050 |
| Regression | UVAWS | AGIS (c) | 0.421 | 0.031 | 13.502 | 0.000 | 0.360 | 0.482 | 0.421 | 0.446 |
| Regression | Distancing suburb | AGIS (d) | 0.300 | 0.046 | 6.521 | 0.000 | 0.210 | 0.391 | 0.300 | 0.230 |
| Covariance | UVAWS | Distancing suburb | 0.166 | 0.045 | 3.659 | 0.000 | 0.077 | 0.255 | 0.166 | 0.148 |
| Intercept | AVAWS | (b0) | –0.155 | 0.076 | –2.042 | 0.041 | –0.303 | –0.006 | –0.155 | –0.163 |
| Intercept | UVAWS | (b0) | –0.005 | 0.033 | –0.140 | 0.888 | –0.070 | 0.060 | –0.005 | –0.005 |
| Intercept | Distancing suburb | (b0) | 3.387 | 0.050 | 67.855 | 0.000 | 3.289 | 3.485 | 3.387 | 2.532 |
Figure 13 illustrates the full SEM. The patterns involving UVAWS and Distancing remain consistent with partial mediation, and AGIS is associated with both proposed mediators as well as AVAWS. Among the variables included, AGIS has the largest direct association with AVAWS. These coefficients do not establish causal influence or the unique proportion of variance attributable to any one scale.
Footnotes
- Data collected on occupation was coded to Australian and New Zealand Standard Classification of Occupations (ANZCO) major, minor, sub-major and unit groups, then collapsed into categories of Trade/labour (ANZSCO 3, 7, 8) and Professional/service (ANZSCO 1, 2, 4, 5, 6).